Biomonitoring
Salt Marshes
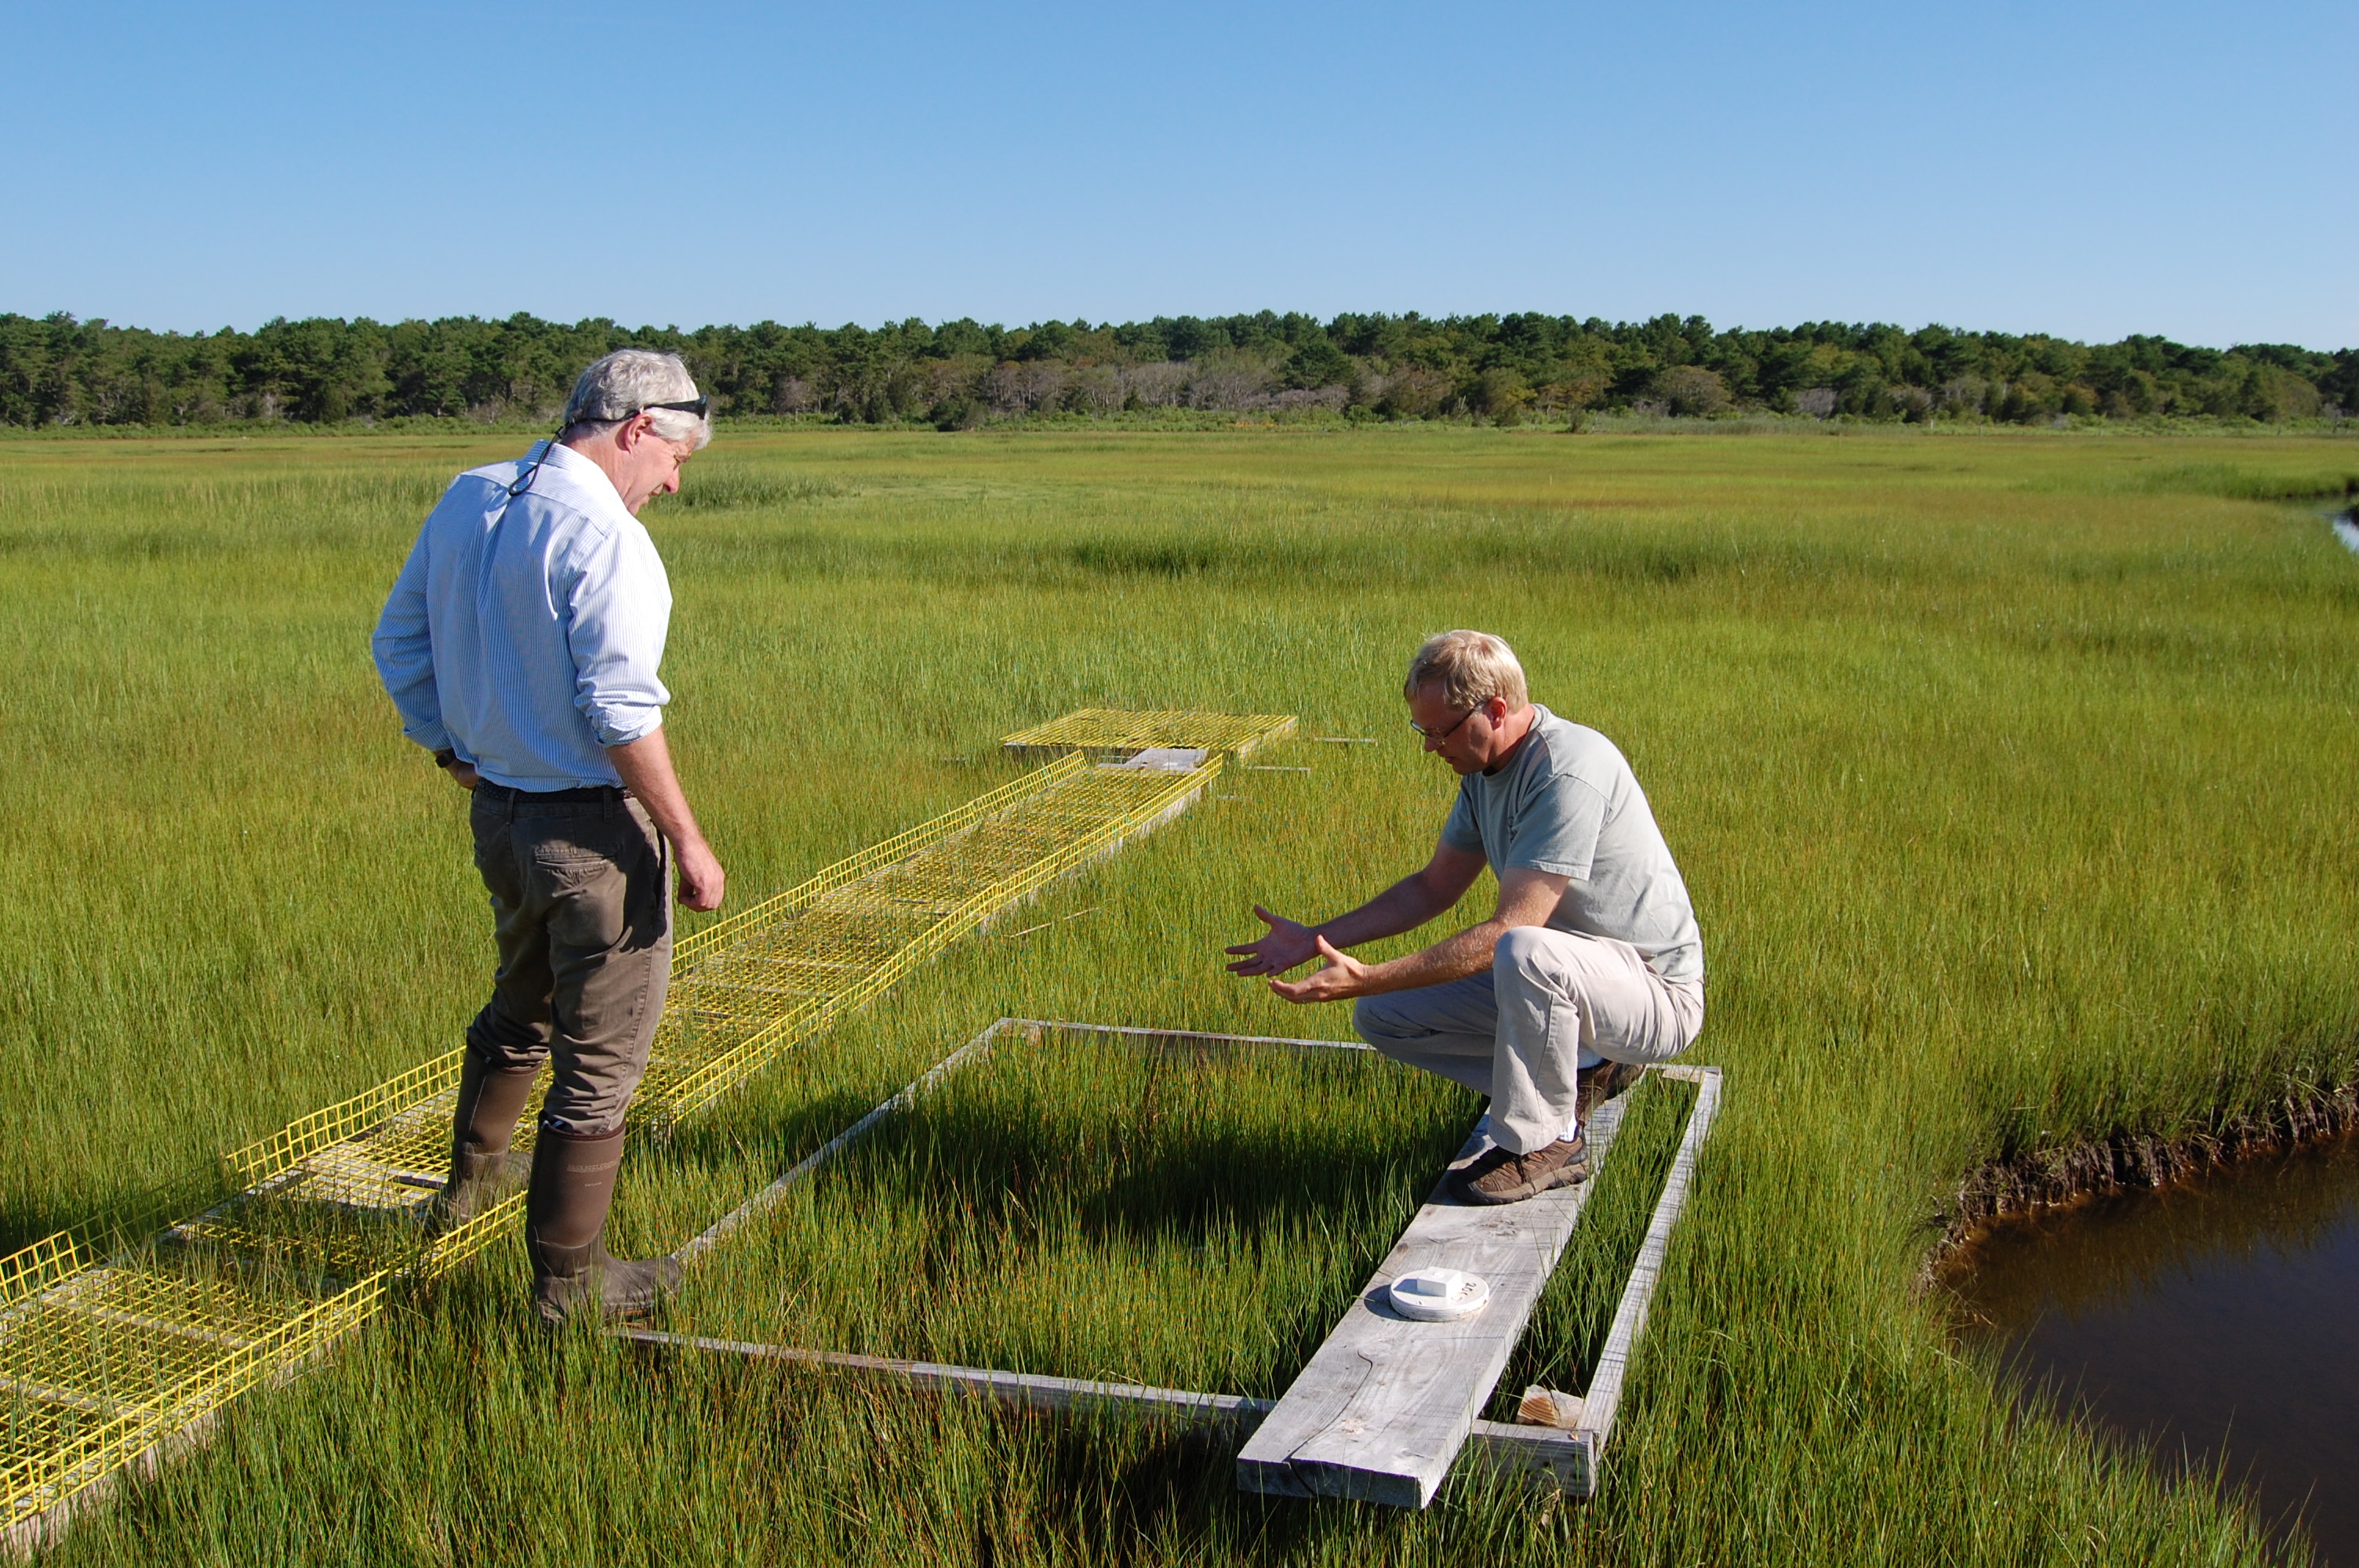
Salt Marsh Observatory Sea level rise and climate change present major threats to salt marshes nationwide and around the world. To better track and understand their impacts on marsh vegetation and sediment accretion, the National Estuarine Research Reserve System has established Sentinel Sites at reserves around the country. Below are descriptions of two recent projects that WBNERR staff have participated in that synthesize salt marsh sentinel site data from our own Sage Lot Pond and similar sentinel sites at other NERRS.
A National Synthesis of Tidal Marshes to Detect Impacts of Climate Change across Multiple Scales
Tidal marshes are facing tremendous pressures from climate change, including accelerated rates of sea-level-rise, increased storm activity and precipitation extremes, lengthened growing seasons and shifts in salinity regimes. Recent research within National Estuarine Research Reserve (NERR) sites has revealed striking changes in plant communities that seem to be caused by rising seas, including shifts toward more flood tolerant species, lower overall plant diversity, and in some cases expanding swaths of bare ground. This project (NERRS Science Collaborative Project Page) will leverage the Reserve System’s geographic diversity, nationally coordinated monitoring program, communication networks, and strong record of collaborative research to conduct a groundbreaking national study examining how marsh plant communities are responding to climate change.
Synthesizing Monitoring Data to Improve Coastal Wetland Management Across New England – Salt marsh monitoring data collected from the four New England National Estuarine Research Reserves (NERRs) from 2010 to 2017 were combined to form one homogeneous database. These data were collected as part of the NERRs System Wide Monitoring Program (SWMP) to help manage local and regional salt marshes. The goal for this project (NERRS Science Collaborative Project Page) was to synthesize the sentinel site data from salt marshes and identify significant changes over time in plant species abundance and marsh surface elevation as distinct from natural annual variation and provide products to help guide syntheses in different regions. As primary stakeholders, Reserve staff wanted to know if there were changes in their salt marshes and if such changes were reflected in the larger geography of New England. With funding by the NERRS Science Collaborative, Principal Investigator David Burdick and the rest of the project team developed a Fact Sheet and a Guide to Integrate Plant Cover from Two Different Methods: Point Intercept and Ocular Cover, and a How to Guide for Synthesizing NERRS Marsh Monitoring Data.
SETr: Developing Tools and Visualizations to Track Changes in Wetland Surface Elevation
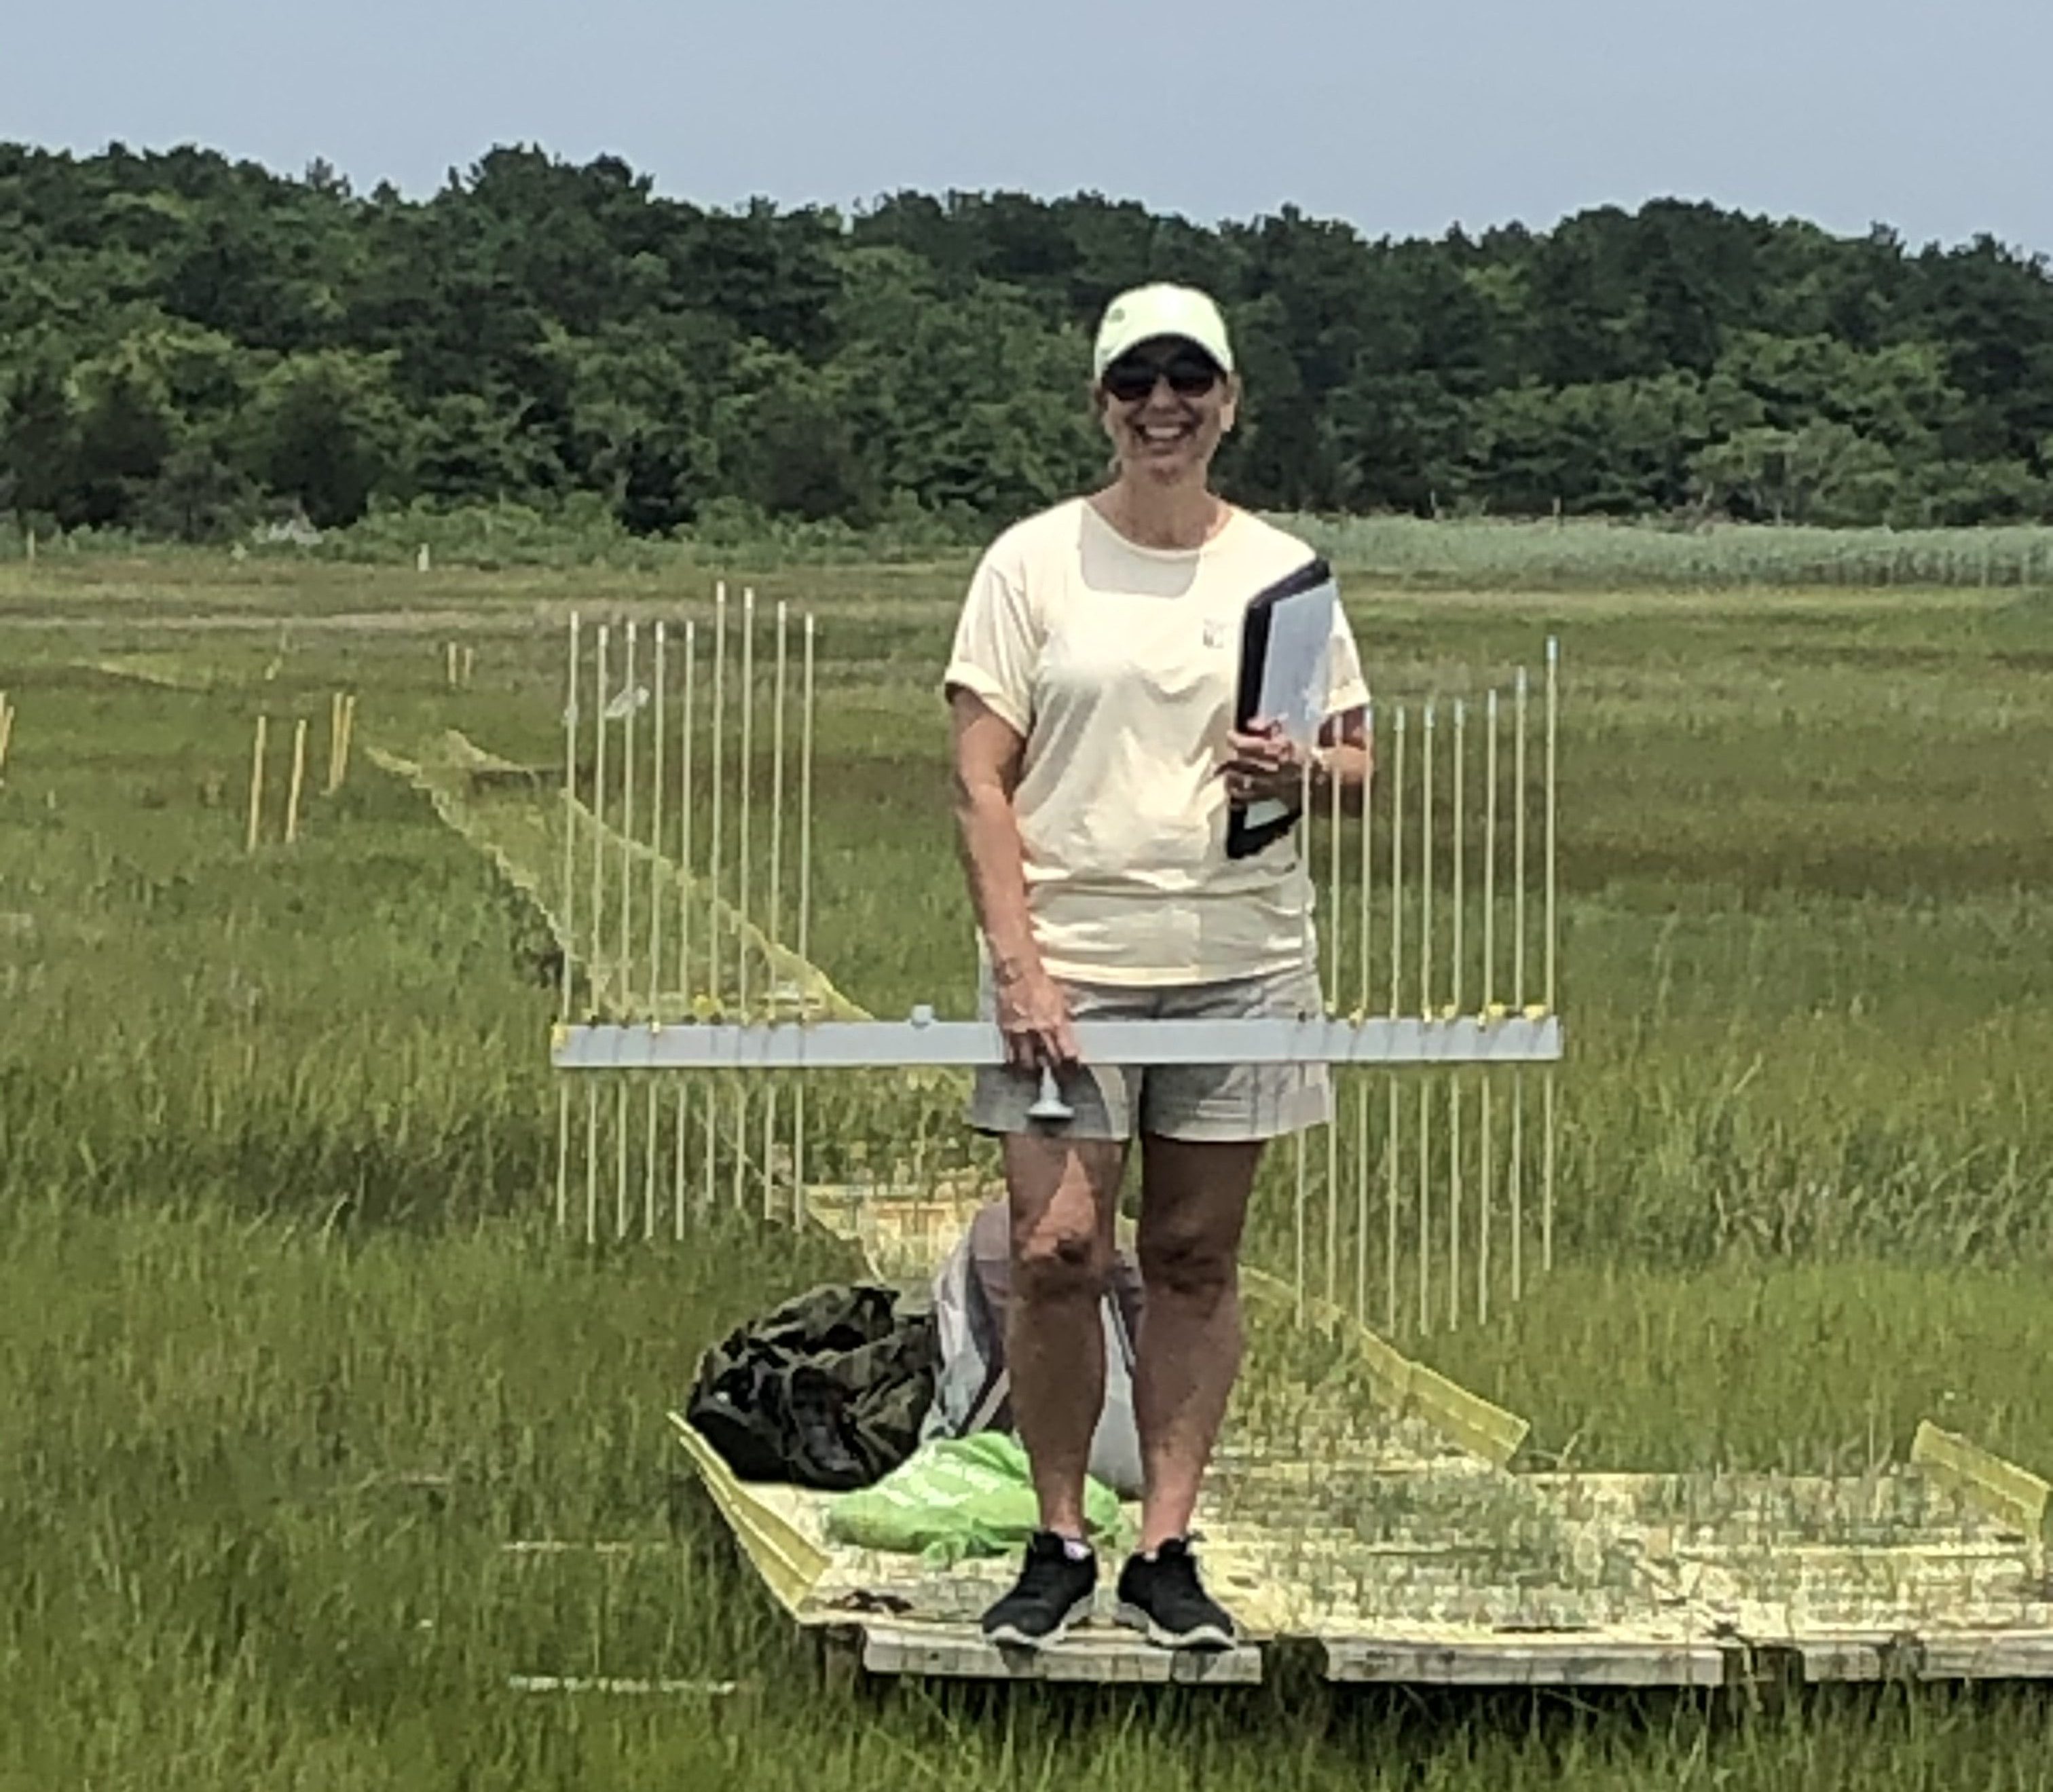
Surface Elevation Tables (SETs) are used to collect observational data on accretion or subsidence/erosion of the salt marsh surface through precise measurements over time. The SETr Project, headed by Kim Cressman at Grand Bay NERR and funded by the NERRS Science Collaborative, produced R scripts for easy data visualization and analysis for SET data. Fifteen Reserves, including Waquoit Bay NERR, submitted data for this project. The Waquoit Bay NERR’s SET Results from 2013-2108 and comparisons to local water level changes or long term sea level rise are shown in tables and graphs. The Waquoit Bay NERR Research Coordinator, Megan Tyrrell, presented with Kim Cressman and the team statistician, Brook Russell on the technical results from a national synthesis of SET data from fifteen participating Reserves which represented trends from 147 SETs distributed along the US West Coast, Gulf and Southeast Coast, the Mid-Atlantic Coast and the Northeast.
Click here to see a recent presentation by WBNERR Research Coordinator for the Teachers on the Estuary training program. This presentation contains a brief overview on how SETs are used to monitor salt marsh elevation change, a glimpse of WBNERR’s SET data from 2013-2018, and photographs from the thin layer sediment addition experiment conducted on the north side of Sage Lot Pond.
Salt Marsh Biomonitoring:
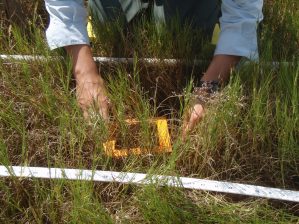
Human impacts (e.g., nutrient enrichment or tidal restrictions) and environmental stressors (e.g., climate change effects such as precipitation rates and sea level rise) can drastically alter the spatial distribution and species composition of salt marsh plant communities. Changes in the biological structure of the marsh can result in reduced habitat and function. By closely monitoring the biological and physical variables of salt marshes over time, coastal researchers and resource managers will have a better understanding of how these estuarine systems respond to particular disturbances, and consequently, will be better equipped to protect the future health and integrity of coastal marshes. Surface elevation tables have been monitored annually at South Cape Beach Sage Lot Pond since 2013. In over 100 permanent, 1 m sq. plots spanning from the seaward edge of the marsh up into terrestrial upland communities, plant species are recorded by percent cover and density. In addition, crab burrow counts, plot photos, and presence/absence of crab and snail species are noted.
FACT SHEET: Communicating Results from the Tidal Marsh Resilience Synthesis
FACT SHEET: Assessing Tidal Marsh Resilience to Sea Level Rise at Broad Geographic Scales with Multi-metric Indices
Salt Marsh Meteorological monitoring:
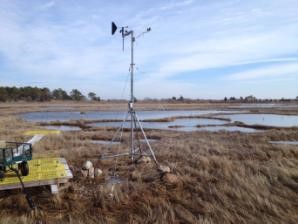
The Sage Lot Meteorology (MET) Station, including photosynthetically active radiation (PAR), total solar radiation, precipitation, and wind sensors, was installed in February 2013 as part of the “Bringing Wetlands to Market” (BWM) NERRS Science Collaborative Project, awarded in Fall 2011. The air and soil temperature probes (0, 15, 30 cm depth) were installed in May 2013 for the same project. The salt marsh MET station data extends from 2013-2018. Please reference the metadata, for more details, contact the research coordinator.
Submerged Aquatic Vegetation

Submerged Aquatic Vegetation (SAV – macro-algae and eelgrass)
One of the biggest contributors to poor water quality on Cape Cod is the addition of too much nitrogen to the bays. Septic systems are the primary source (only about 15% of the Cape is sewered, and septic systems do almost nothing to remove nitrogen), though fertilizer and air pollution also play a role. Delivered to the bay by groundwater or surface run-off, the nitrogen acts as a fertilizer leading to large algae blooms, which shade and kill eelgrass and deplete oxygen from the water. Surveying the distribution and species composition of SAV over time helps illuminate how this process may be changing in Waquoit Bay, revealing, for example, if new species of algae are becoming dominant, whether the little remaining eelgrass is disappearing, or whether climate change is affecting SAV distribution. Thus, the survey helps determine how natural and/or human-caused factors may influence the overall health and sustainability of the estuarine system. Surveys were done in 2004, 2007, 2011, and 2016. Analyses of intriguing trends related to nutrient inputs and increasing water temperatures, including declining eelgrass but variable changes in algae biomass were presented by Jordan Mora at the New England Estuarine Research Society Meeting in 2018
But why the decline? Shifts in macroalgal biomass in a eutrophic microtidal estuary
(Poster presented by Jordan Mora, 2018)
What’s Trending in Waquoit Bay? (2018 Presentation Research at the Reserve & Women in Science class, Jordan Mora)


